The work of mapping sea floor (Bathimetry) is one of the Hydrographic jobs. The use of multibeam echosounder for mapping sea floor is rapidly growing. Multibeam echosounder is a very efficient way to get broad coverage sea floor, so as to produce high-resolution of sea floor maps. The maps can then be used as a reference for further investigation or exploration, such as geological studies, marine habitat, etc.
R/V Barunaja IV is owned Marine Survey Technology Center BPPT, in onboard have been equipped with Multibeam Sonar System (MBES), namely ELAC Seambeam 1050D. It is producted by Elac Nautical German. The vessel is also equipped with multibeam data acquisition software (hidrostar) that directly displays the depth profile of the seabed in realtime and wide coverage, so it can be directly monitored during data acquisition. There is also onboard processing (HDP edit & HDP Post Software), so that the multibeam data can be directly processed and viewed the results, while still on the vessel.
On July 21th to August 7th, 2010, R/V Barunajaya IV took part in the expedition to explore the deep sea in the Northern Sea of North Sulawesi Province, precisely in the sea near Sangihe-Talaud archipelago on Indonesian Exploration Sangihe-Talaud 2010 (INDEX / SATAL 2010). Barunajaya IV succeeded in mapping sea floor in the west of Siau Island (part of Sangihe Archipelago) with multibeam and the results is displayed in 3D.
I. Introduction
On July, 21th – August, 7th, 2010 scientists from Indonesia and the United States of America have worked together on an expedition to explore deep-sea in the northern waters of North Sulawesi Province, precisely in the Sangihe-Talaud archipelagic waters. The expedition is called INDEX / SATAL 2010, short for Indonesian Exploration Sangihe Talaud. This exploration by R/V Barunaja IV (BPPT) and R/V Okeonos Explorer (NOAA-USA). While working on board the scientists hope to discover deep-sea ecosystems (marine habitat), the understanding of seabed geology, and new discoveries in marine living organisms. One of the jobs in the exploration of deep sea that has a vital role is mapping the seabed with multibeam sonar system (MBSS). Sea floor mapping with multibeam will produce high-resolution of seafloor maps. These maps are then used to identify characteristics of unique seabed, to the investigation or further exploration, one of them is trawling activity to get a marine habitat and the organisms that exist in it.
One of the objects is tried to find in INDEX / SATAL 2010 project are seamounts. Seamounts are submarine mountains which are remnants of underwater volcanoes. 1000m-high mountain of the sea burst the deep seafloor, so that the slopes are usually steep and entirely under the sea.
II. Multibeam Seabeam 1050D
II.1. Multibeam Seabeam 1050 System
R/V Barunaja IV is owned Marine Survey Technology Center BPPT, in onboard have been equipped with Multibeam Sonar System (MBES), namely ELAC Seambeam 1050D. It is producted by Elac Nautical German. Seambeam 1050D has a frequency of 50khz, so it can perform mapping of the deep ocean until 3000m of depths. The number of beam are 126 and have 153° of beam width. Hidrostar software is used for acquisition of multibeam data that can directly display the depth profile of the seabed in realtime and wide coverage, so it can be directly monitored during data acquisition. Processing of Multibeam data can be carried out onboard so directly viewable result. Coverage area and maximum depth of 1050 seabeam can be presented in the figure 1.

Figure 1. Maximum depth and coverage area of Seabeam 1050D
II.2. Configuration of Seabeam 1050D
Seabeam 1050D that does onboard in R/V Barunajaya IV has configuration can be presented in the figure 2 
Figure 2. Configuration of Seabeam 1050D
As seen in Figure 2, that seabeam 1050 multibeam system consists of :
1. Transducer (transmit and receiver) frequency of 50 Khz and 180 KHz
2. Sonar processing unit SEE-30-40.
3. Surface Sound Velocity (SSV) onboard near keel of vessel.
4. Sound Velocity Profile (from data CTD Seabird SBE 9plus or SVP which is a package seabeam 1050D)
5. F180 Coda Octopus
Integrated navigation equipment capable of generating position data (GPS Receiver function), a heading / course (GPS Gyro function), and the attitude of the vessel (the functions of the MRU)
When the multibeam data acquisition, data from several sensors that are inputed into software hidrostar either manually or in real time is as follows :
- Position Latitude / Longitude or Easting / Northing and speed of vessel from the GPS receiver F180 octopus (input real time).
- Ship attitude data (pith, roll, heave, yaw) of the existing MRU system from F180 Coda Octopus (input real time)
- Heading and course data from the GPS gyro exists on the system F180 Octopus(input real time)
- Surface Sound Velocity data from the SSV equipment that onboard in R/V Barunajaya IV (input real time).
- Sound Velocity Profile Data from CTD Seabird SBE 9plus data. Entered on hidrostar as an ascii file *. SVA (manually input)
- Data offset between the sensors with respect to the NRP, short from Nautical Reference Point (manually input and it is saved in vessel).
- Calibration attitude of vessel dan time delay.
- Data No. 5 and No. 6 are recorded in file ASCII which have extension *.ship (in hidrostar software which is named ship parameter).
These data and the data acquisition from the transducers further computed by hirdostar software with certain algorithms that generate the depth data along with its position on the coordinate system (can be geographic or UTM projection). Results hidrostar acquisition remains to be done editing and filtering with multibeam data processing software to eliminate noise. for filtering and editing software we use HDP Edit and HDP Post, which both run by the operating system lunux suse. whereas for 3D visualization, we use fledermous software.
II.3. Coordinat System in Hidrostar Software
Coordinate system on hidrostar software to calculate the position of each depth from each beam uses a system of inverted right-hand rule. This system uses the point of origin (0,0,0) in Nautical Reference Point (NRP). NRP is assumed to be the intersection of the surface water (water line) with a transducer Pole. The position of NRP is illustrated in Figure 3 :

Figure 3. The position of NRP on the R/V Barunajaya IV
In this coordinate system, axis of the ordinate (Y) is the axis from the aft towards the bow and cut the NRP. Ordinat (Y) is always a positive value from the reference point toward the Bow. Abscissa axis (X) is the axis from the right side of the ship (starboard) towards the portside hull (port) and cut the Y axis in the NRP. X is always a positive value of the reference point toward the port. Z axis is the axis perpendicular to the axis X and Y as well as a cut Reference point. Z will be positive from the reference point downward. Hidrostar coordinate system can be shown in Figure 4

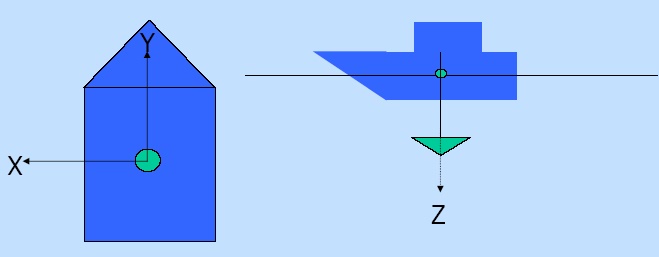
Figure 4. Hidrostar Coordinate System on R/V Barunajaya IV
Offset navigation sensors data are referenced to th NRP by calculating the offset refers to the hidrostar coordinate system. Navigation sensor data offset in the R/V Barunajaya IV can be presented in the figure 5 :

Figure 5. Offset navigation sensors data on R/V Barunajaya IV
I. Onborad Processing Multibeam Data on R/V Barunaya IV.
The format of the data acquisition are ELAC Multibeam (*. dat), XSE Storage (*. XSE), and UNB storage (*. UNB). R/V Barunaja IV are equipped with software to process *. Dat, *. XSE, and *. UNB data. The *. XSE and *. UNB must be processed by Caris software. Software that are onboard the R/V Barunajaya IV for multibeam mapping is as follows:
- Hypack 6.2a
Sotfware navigation for planning surveys and help line for drivers navigating the ship. When the status of logging, Hypack will display the navigation data such as position, heading, bearing, distance already traveled, distance remaining, and the deviation of the ship on line survey that was made. In addition to help navigation, the software can also record data from the navigation sensors are connected to hypack, such as the depth of the echosounder, the position and velocity of the GPS, heading from the GPS Gyro
- Hidrostar 3.5.3
Software to acquire multibeam data and can display the depth profile data in real time (there is still noise).
- Post processing Software HDP 4061
This section there are 2 software these are HDPedit and HDPpost. HDPedit for filtering the depth and position data. HDPpost to process the depth and position data involving Sound velocity profile, ship parameters, tide, geodetic datum and projection system that is used. HDPpost can be used to produce gridding, contour map, DTM, and maps 3Dimensi, but usually only used to generate data X, Y, Z ASCII format. Softawre HDP 4061 running the Linux operating system with Open Suse 10 distro.
- Fledermous
Fledermous software is used to make 3D display from x,y,z data. But it also used software Caris and surfer to make a 3D display and create a contour map of depth.
Workflow software for acquisition and processing multibeam data which are onboard the R/V Barunajaya IV can be illustrated in the figure 6 :

Figure 6. Workflow of Software that is Onboard at the R/V Barunajaya IV
I. Result of Bathimetry Mapping.
One of the interesting results of the bathimetry mapping with Seabeam 1050D in INDEX SATAL 2010 project is bathimetry in the western sea of the island of Siau. Line survey was made of the direction extending from the North - South and South - North. The width of space between lines are created 2300m. Bathimetry mapping results is shown in the UTM system with zone 51N (map projection) and datum used is WGS 1984, as presented on the map in the figure 7 :

Figure 7. Bathimetry Map in West of the Island of Siau
In the sea between the island of Siau and the island of Makalehi is found insteresting objects like sea mount. It has slopes which the depth of 2000m in the north, while the depths of 1800m in the south, when a peak depth of 710m, so the burst height of more than 1000m and all under the surface of the water sea (as defined seamounts). Here is presented the profile depth of the slopes of the southern and northern sections towards the peak.


Figure 8. Profile slopes in Northern

Figure 9. Profile slopes in the Southern
Referensi
- User’sManual Hypack 6.2a, Hypack, Inc. 56 Bradley St. Middletown, CT.
- Reference Manual Hydrostar Software Version 3, ELAC Nautik GmbH, Kiel, Germany.
- Post Processing Software HDP 4061Version 9.10, May 2001 L-3 Communication ELAC Nautik GmbH.
- Http://oceanonexplorer.noaa.gov/okeanos/explorations/10index/welcome.html
Tidak ada komentar:
Posting Komentar